Free trials are available for all potential subscribers to assess the suitability of all of our data products for their needs. Trials are available for all markets and strategies that delivered with a full subscription. The only difference being that they are delivered with shortened data histories. Please contract us if you are interested in a trial – there is no obligation to subscribe.
Futures data files are currently available for download in .csv format through API links delivered via email New subscribers have access to two databases available for download. The Historical databases include all futures strategies history for each of the nine markets and is updated monthly on the first calendar day. The Daily update database includes historical daily updates for all the currently open contracts for each specific market and append seamlessly to the Historical databases if they have been purchased. Each strategy file contains strategy data dating back to contract inception, so if you miss a day or two, the latest file will include a full history including any dates missed.
For all strategies, with the exception of historical volatility, daily settlement prices, volume and open interest data are used to construct the spread strategies with the open, high and low, exhibiting the same values as the settlement value. For spread strategies, the volume and open interest numbers reflect the daily difference between the volume and open interest values for each component contract. The resultant volume and open interest values may thus be positive or negative and in most cases will become increasingly negative as the front month approaches expiry and liquidity switches from the front month contract to deferred contracts. These volume and open interest values can be particularly useful for optimizing roll dates as the historical spread data can reveal when volume and open interest start to turn increasingly negative as the front month contract in the spread approaches first notice day or last trading day. Historical volatility volume and open interest reflect the daily numbers for the underlying derivative contract.
Industry spread convention subtracts the second or deferred contract data from the first or nearby contract data. Daily volume data is valid for the same date as the daily price data and open interest data is delayed by one day.
Historical volatility data is calculated using the annualized 21-day rolling realized volatility convention and unlike spread strategies historical volatility is calculated for open, high, low and settlement prices. Historical volume and open interest data reflect the daily values for the underlying contracts.
All datasets are delivered in the industry-standard 7-column format comprising: Date, Open, High, Low, Close, Volume and Open interest.
As electronic trading continues to expand over into holiday sessions, several exchanges, including the CME Group and the ASX have begun to publish settlement prices for some markets on holidays when electronic trading takes place. As a result, all our datasets assume a 5-day trading week with data carried over from the previous session to compensate for missing data during holiday closures.
Currently we offer nine Historical and Daily subscription packages The Financials packages include data covering Bonds, Equity Indices, Foreign Exchange and Money Markets futures strategies. The Commodities packages include data covering Energy, Grains, Livestock, Metals and Softs futures strategies.
Historical databases are available for all nine markets and are available for purchase as stand-alone packages without a subscription to the corresponding daily update service. They include all historical strategy data for each market dating back to 1974 or contract inception, whichever is earlier. A comprehensive list of inception dates for each strategy can be found in the List of Markets on the homepage.
Daily Update subscriptions are available for 6-month and 12-month periods. Data files for each market include data associated with open contracts updated to the most recent trading session. API links for all data subscription packages are delivered to subscribers via email after 7:15 PM EST Monday-Friday and data files typically take just a few seconds to download. Daily updates for basis-spread strategies are delivered in a similar manner and are available to download after 9:15 PM EST Monday-Friday.
All dataset files are in .csv format with filepaths following a logical structure employing annotated combinations of strategies, futures market abbreviations, years and months. A detailed list of strategies, markets, months, start dates and symbols are available via the List of Markets link on the homepage. Data for each market is grouped according to strategy, for example:- for grains markets, inter-commodity spread data is in the inter-commodity spread folder which is distinct from grains basis spread data which is found in the basis spread folder. For bond market strategies, bond market inter-market data is similarly separate from bond market historical volatility data. Contract basis spread data is currently only available for commodity contracts.
Navigating the databases and locating files is straightforward and further simplified by the data frame logic and file structure. For example:- the historical calendar spread data for February 2018 and April 2018 Lean Hog contracts would have the filepath – CS_LH_2018_GJ. The historical volatility data for the July 1999 Natural Gas contract would have the filepath – V_NG_1999_N. The data for the inter-commodity spread between the June 2023 Euro and the June 2023 Swiss Franc futures contracts would have the filepath – IC_EC-SF_2023_M. The historical data for the February 1995 WTI Crude Oil contract basis spread would have the filepath – C_CL_1989_G.
Spread strategies are quoted in decimal format and volatility quotes are quoted as annual percentages. They thus replace the incremental eighths associated with the CME grain quotes and the 32nd and half 32nd incremental price quotes associated with the CME interest rate futures contracts. All spreads are calculated using exchange clearing house published settlement prices. If the contract has no trading volume for a particular day the settlement price represents an estimate of where the exchange determines it should have traded at settlement time. The settlement price may be the same as the last traded price, but not necessarily so as in thinly traded contract moths the last trade may have occurred hours before settlement time. The settlement price is what traders focus on as this is the price used for marking open positions to market and for determining daily performance, margin calculations and risk assessment.
The free trial, full transparency and direct data access we offer to potential subscribers reflects our confidence in the accuracy and cleanliness of our data products. We encourage all potential subscribers .to contact us to take advantage of a free trial to ensure the data packages offered meet their needs and to access the interactive charts and judge the data integrity for themselves as all sales are final and we do not offer refunds.
Online support is available for any issues you might encounter and we will endeavor to resolve any problems in a timely and efficient manner. Please use the Contact Us link and describe the issue in as much detail as possible as the more information we have the better equipped we are to provide assistance.
Futures markets are comprised of multiple contract months with individual expiry dates which trade simultaneously with each other. The first contract is referred to as the spot or front month and is the first contract to expire. The first contract is followed by deferred or back months which expire in succession according to the schedule determined by each exchange. As one contract month expires a new one is added. For example, Natural Gas futures contracts expire monthly. Natural Gas has the symbol NG and specific contract maturities can be identified by using the combination of symbol, month and year described below. Natural gas has one of the deepest forward curves with active monthly contracts extending out more than 10 years into the future.
Futures contract month symbols:-
F January
G February
H March
J April
K May
M June
N July
Q August
U September
V October
X November
Z December
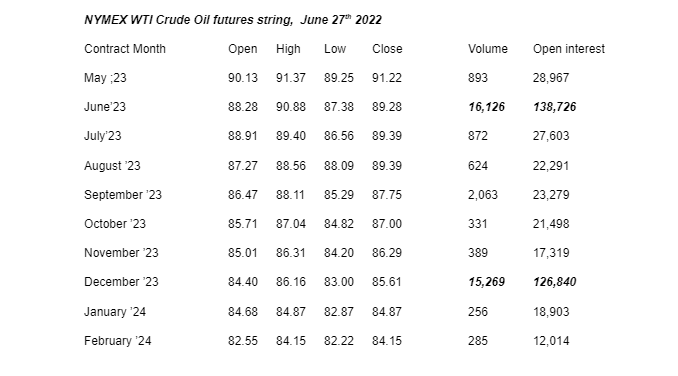
Rising volume together with rising prices is typically associated with confirmation of a strong bull move and conversely rising volume associated with falling prices is typically regarded as confirmation of a strong bear move. Trading volume in futures markets is typically concentrated in the front months and tends to diminish as one goes further out into the future contract months. However, each market has its own idiosyncrasies. Equity indices tend to have liquidity concentrated in the front month, conversely commodity contracts exhibit volume spikes in specific contract months, The table below exemplifies this characteristic for the WTI Crude Oil contract and shows the elevated volume in the June and December contracts. Most exchanges publish same day contract volume figures, however, open interest figures, with a couple of exceptions are reported with a delay of one day.
Open interest is another measure of liquidity and quantifies the outstanding open positions for a specific futures contract. As the contract approaches contract expiration volume and open interest tend to decline rapidly as open positions are submitted for delivery or closed out by market participants. This feature is captured in the spread strategies with volume and open interest spreads declining and even turning negative as open positions in the front month are closed out or rolled forward as first notice day or expiration date approaches.